In the next two generations, the natural population of England & Wales[1] is projected to halve, a decline driven largely by increasing childlessness. Current projections suggest that more than 25% of women reaching age 45 in the next 20 years will do so without having children. Our analysis indicates that approximately half of this projected childlessness can be traced to earlier abortions. We show that in 2022, it is very likely that more than 5,000 childless women aged 29, presenting for an abortion, were not warned of the 50% chance that they would remain childless at 45.
A persistently below-replacement birth rate, or worse, a further decline, will pose serious challenges for our society and economy. From workforce shortages to an unsustainable age structure, the consequences will be far-reaching. If we are to address this issue responsibly, we must confront all contributing factors—including the role of abortion—with honesty and urgency.
In August 2025, the Office for National Statistics (ONS) announced for England and Wales that the total fertility rate (TFR) in 2023 was 1.41, “the lowest value on record for the 3rd year in a row.” [2] [3] The ONS principal projection for TFR in 2027 is 1.41, rising slightly to 1.45 in 2047.[4]
Total fertility rate
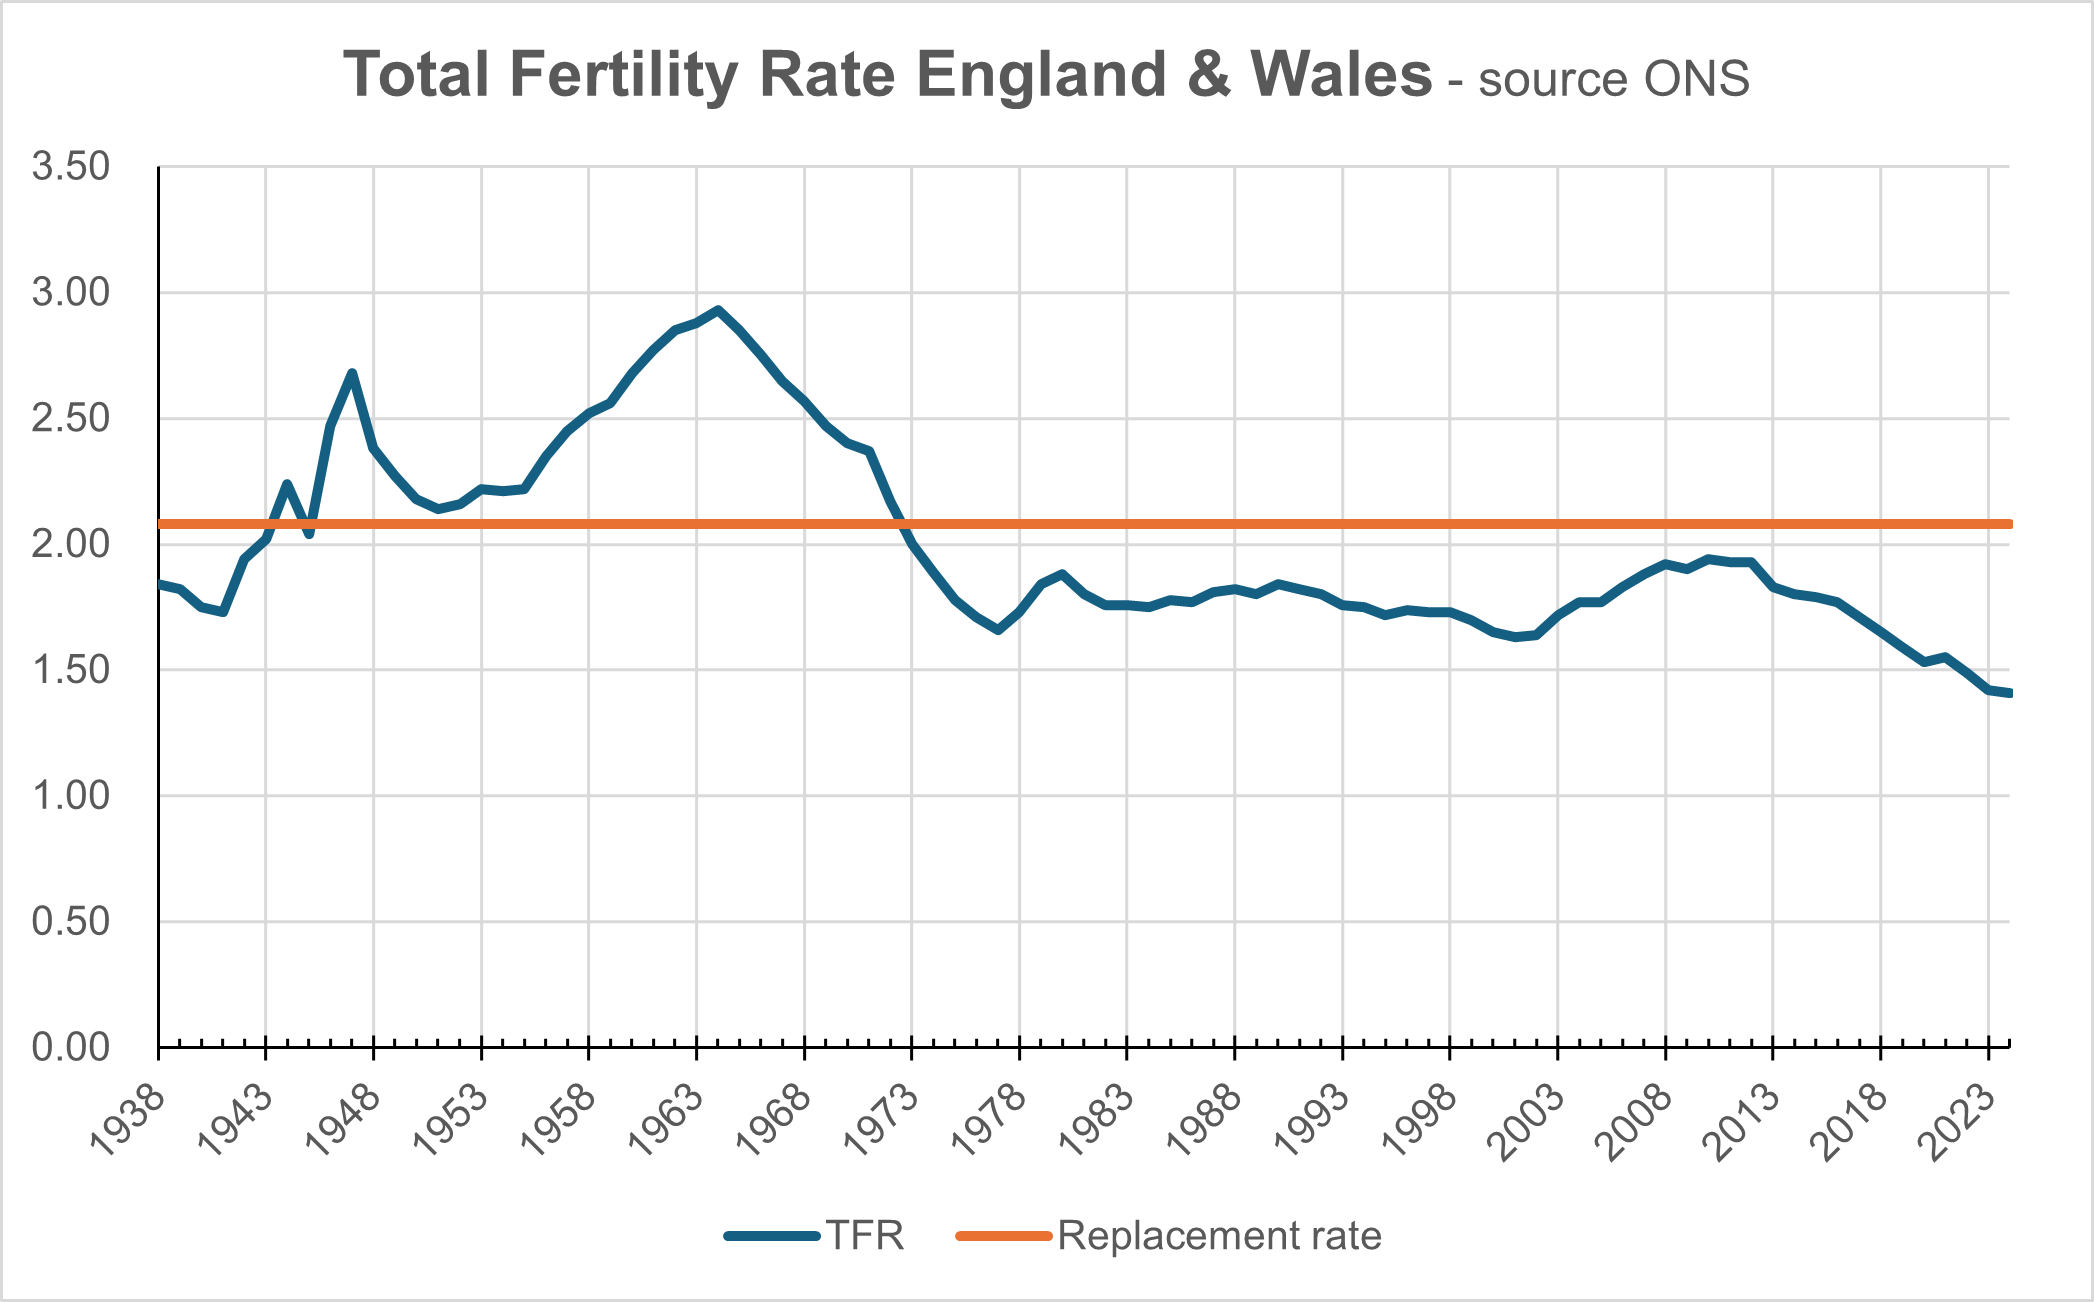
Replacement-level fertility requires a TFR of just under 2.1,[5] which will ensure a level population number, assuming no change in mortality rates and discounting net migration. Ours has been below 2.1 since 1973 and, if it continues at this historic low of 1.41, will have a very significant demographic impact in coming generations: 100 young adults today will have 71 children and, in turn, they will have 50 children.
Completed family size and children per mother
The total fertility rate is a projection of the average number of children that young women today might have by the time they are finished their reproductive years, typically at age 45. The Office for National Statistics also publishes data related to completed family size and the proportion of women who have a particular number of children.[6] In a recently published paper, demographer Stephen J Shaw discusses how it can be more insightful to review data for completed family size and numbers of children per mother; in particular Shaw says that using the following three metrics rather than just TFR, can highlight the impact of childlessness and the effects of delayed motherhood: [7]
- TMR (Total Maternal Rate): the proportion of women who become mothers in a given period
- CPM (Children per Mother): the average number of children among mothers (not all women)
- TCR (Total Childlessness Rate): the proportion of women who remain childless by the end of their reproductive years (age 45).
Cohorts of women reach age 45
The latest set of fertility data for cohorts of women reaching age 45, was published by the ONS in April 2025; the most recent cohort is the one of women born in the year 1978, reaching age 45 in 2023.[8] This report shows the completed family size (CFS) for that 1978 cohort was an average of 1.95 children for all women. Further analysis shows that the children per mother (CPM) was an average of 2.33 and the total maternal rate (TMR) was 0.84, in other words 16% of women in that cohort remained childless at age 45.
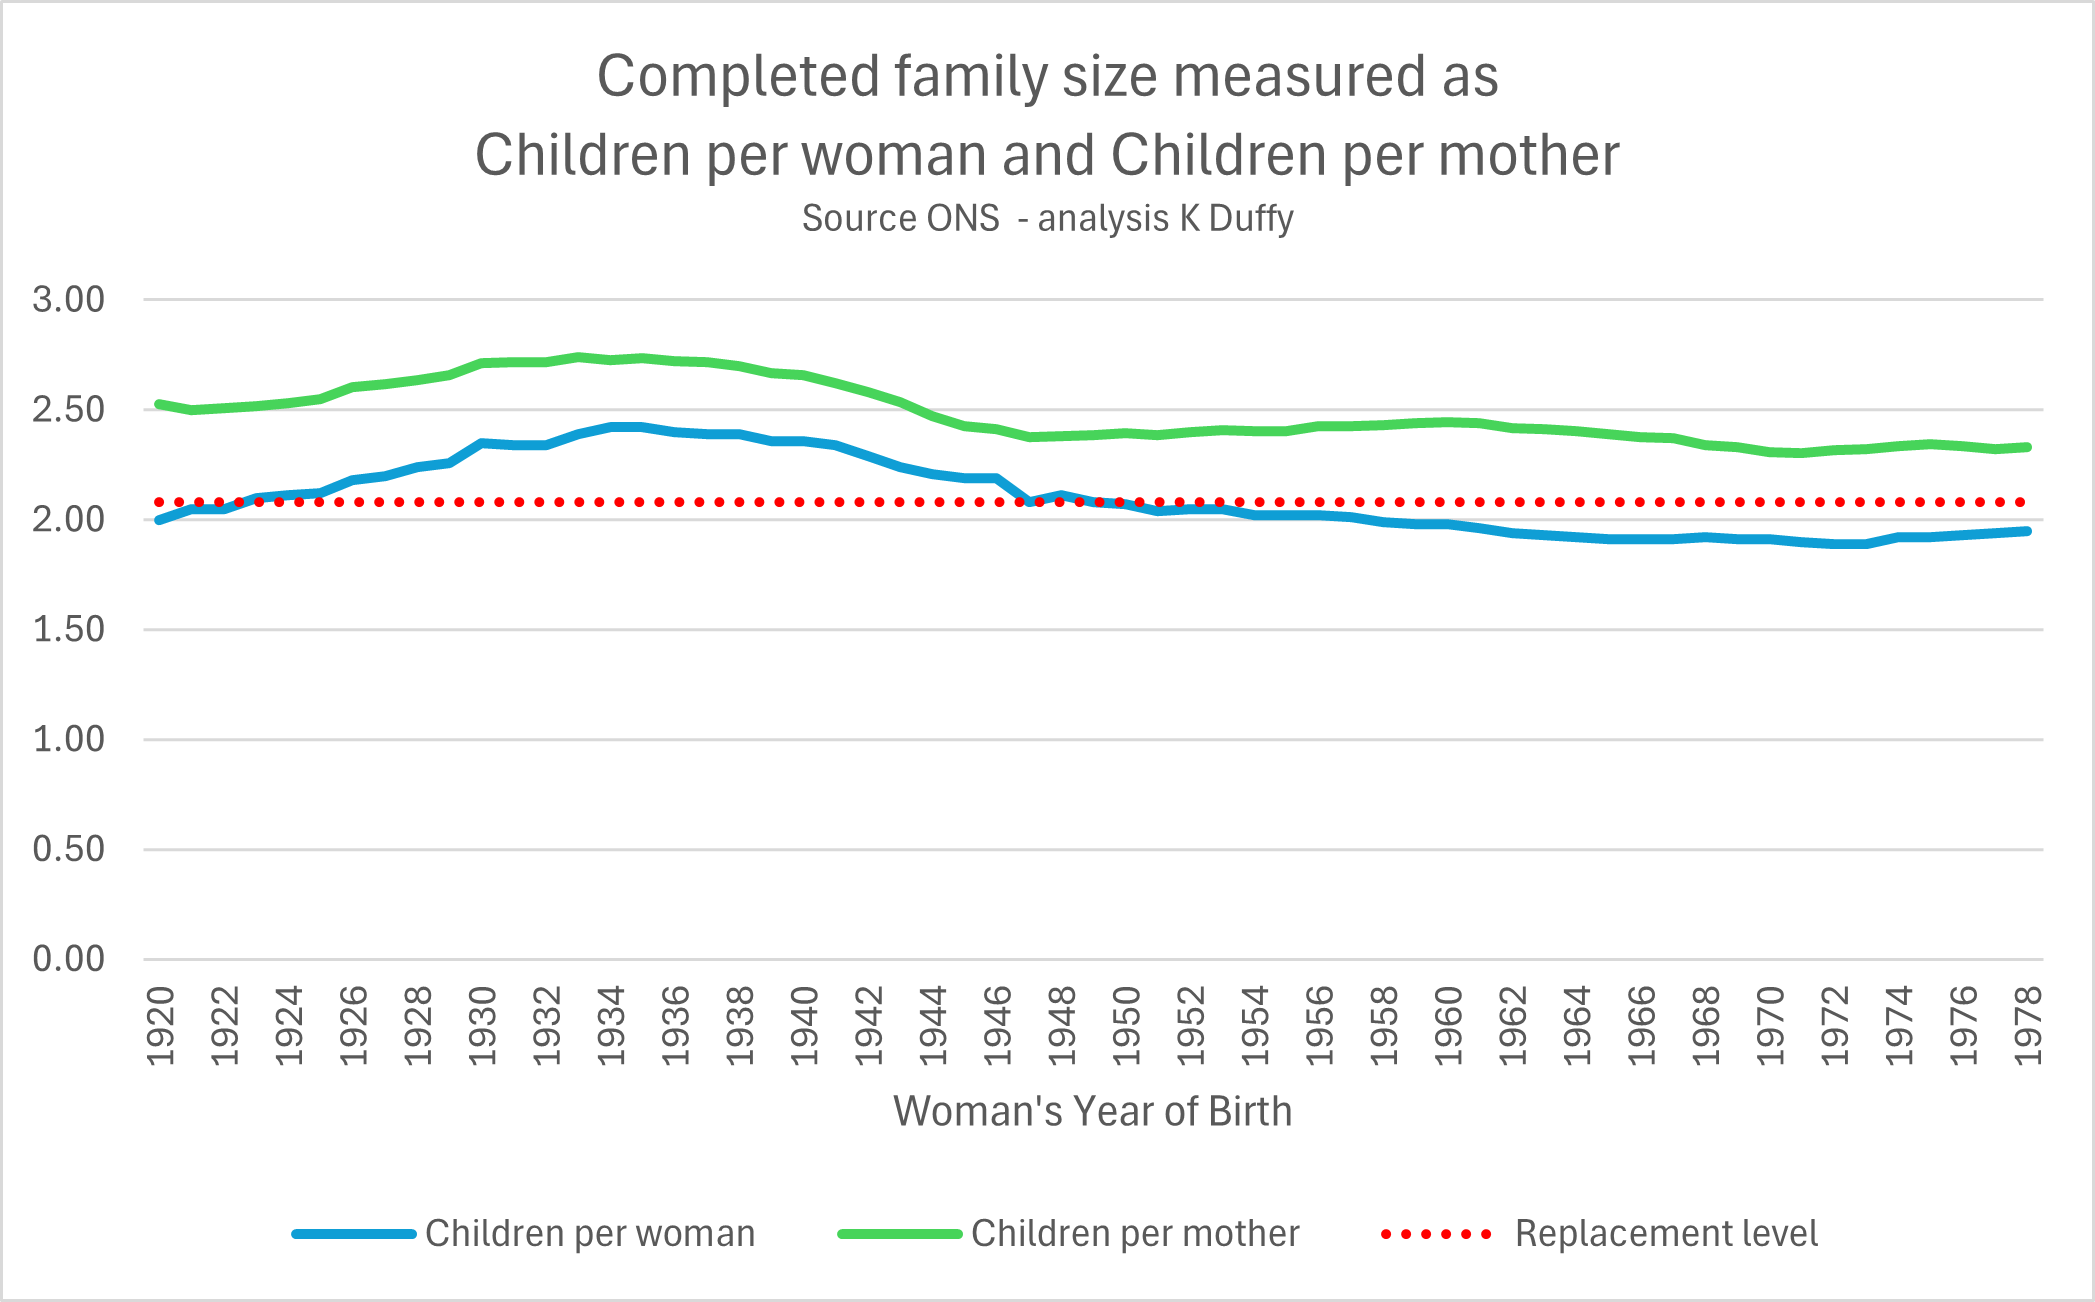
This graph shows the long-term trend, over fifty-nine years, since the cohort of women born in 1920. It is remarkable that in the last thirty years, the average number of children to mothers has remained much the same, 2.3, notably always above the replacement rate. The difference between CFS measured across all women and CPM, is that the former includes women who have no children; including this group of childless women lowers the overall CFS measure and, as can be seen in the graph, this has been slightly less than the replacement level in the last thirty years. The TMR in 2023, 0.84, is the same as the average rate over all fifty-nine years back to the cohort of women born in 1920, so there has not been any significant change in the proportion of childlessness, this has been steady at around 16%.
If there has been little change in these measures over the last fifty-nine years, then why all the fuss about our declining birth rates and why does the ONS officially project that our future TFR will remain as low as 1.45?
Most importantly, we must remember that TFR is a future projection, whereas CFS is a measure of something that has already happened; the ONS is telling us that whilst women over the age of 45 have had an average of 1.95 children (CFS), younger women will have fewer children by the time they reach 45 – the projected TFR of 1.45.
Increasing childlessness at age 30
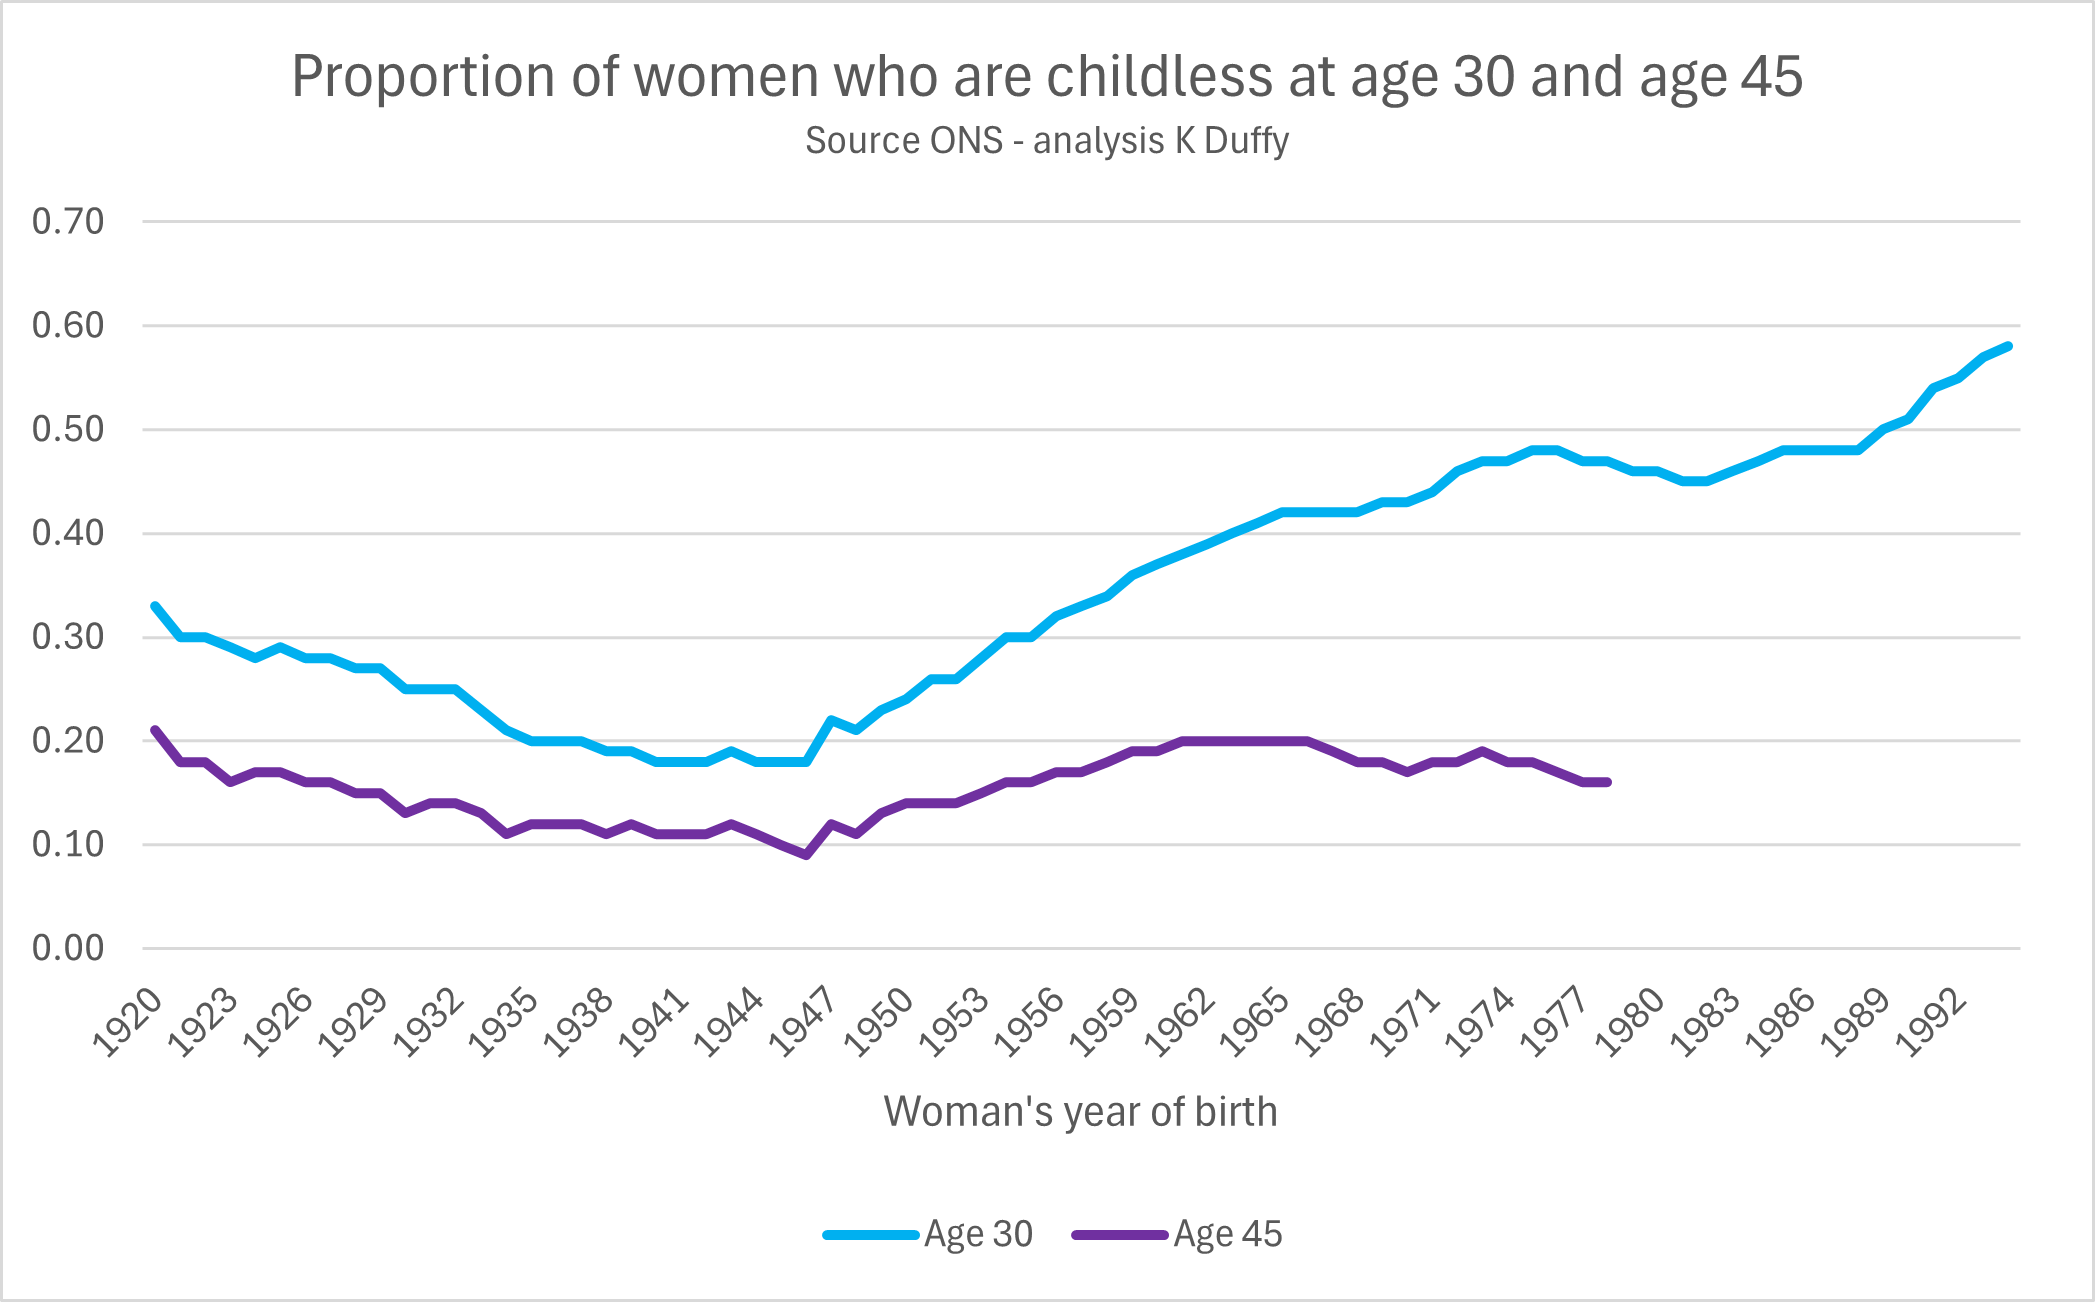
In the last forty years, there has been a steep increase in the proportion of young women who are childless when reaching age 30; a quarter of those born in 1950 were childless at age 30 but this doubled to a half of those born in 1990, and 58% of the most recent cohort of women reaching age 30, those born in 1994, were childless. Looking closer we can see a growing gap between the total childlessness rate at 30 and at 45, but given that TCR45 has remained broadly flat, it does seem that women have, in past years, been able to catch up during their 30s and 40s. So, again we have to ask ‘why all the fuss?’ Why are the ONS and demographers ringing the alarm bells?
ONS panel of fertility experts
In 2024, the ONS convened a panel of UK fertility experts to assess the latest births data and explore a range of plausible future scenarios. Their goal was to recommend a set of planning assumptions for projecting future TFR and CFS.[9]
The panel examined the persistent trend of delayed childbearing among younger women, alongside the biological reality that fecundability declines with age and the window of fertility narrows over time.
Taking into account a wide array of social and economic influences on reproductive intentions—including the cost of living crisis, shifts in childcare support, and broader anxieties about climate change and geopolitical instability—the panel concluded that birth rates among women in their 20s are likely to decline both in the short and long term. They anticipated a rise in birth rates among women aged 35 and over, reflecting a continued shift toward later childbearing.
ONS data show the average age at first birth has risen steadily over recent decades, from about 24 in the early 1970s to just under 31 by 2024. The panel projected that this trend will continue. That matters because if cohorts start childbearing later, even with unchanged completed family sizes, the combination of delayed starts and the fixed biological time limit for fertility, will raise the share of women who end up childless.
Projected completed family size and childlessness
The ONS projects completed family size but it does not project total childlessness rate. However, there is a simple mathematical relationship between completed family size, children per mother, and the childlessness rate which we have used in the table below.[10]
As noted above, in the last thirty years the average number of children to mothers (CPM) has been 2.3. We can model TCR using the ONS projections for CFS and various assumptions on CPM.
| Woman’s year of birth | ONS projected completed family size (CFS) | Children per mother (CPM) | Total childlessness rate (TCR) |
| 1978 | 1.95 | 2.33 | 16% |
| 1994 | 1.63 | 2.33 | 30% |
| 1994 | 1.63 | 2.20 | 26% |
| 1994 | 1.63 | 2.10 | 22% |
| 2000 | 1.54 | 2.33 | 34% |
| 2000 | 1.54 | 2.20 | 30% |
| 2000 | 1.54 | 2.10 | 27% |
- The most recent cohort for which we have completed family size is for women born in 1978, reaching 45 in 2023. Their completed family size was 1.95, and the underlying data show this to be factored from a children per mother rate of 2.33 and a total maternal rate of 84%, hence a TCR of 16%.
- The cohort born in 1994, will have a projected CFS of 1.63 and if we assume CPM of 2.2 (a slight decline), then TCR will be 26% (an increase of 1.6x).
- It is worth noting that if CPM remains the same as it has been over the last few decades, the projected childlessness rate would be higher, 30%.
- The ONS projects a further decline in completed family size for the cohort of women born in the year 2000, down to 1.54, leading to a childlessness rate of at least 27%.
- This table shows that TCR is sensitive to the value of CPM. If mothers have fewer children, then for a given completed family size the proportion of childless women will increase.
At least 25% of women aged 45 will be childless
Whilst these are all projections based on various assumptions, we can probably agree on some key factors:
- Women are postponing the age at which they have their first child. On average, first-time mothers are now just over 30 years old.
- More than half of women reaching age 30 are childless. A majority of these women want to have a family, just not yet.
- Whilst many younger women have been choosing to delay the age of first birth into their 30s, the biological clock has not changed.
- The average number of children for women who start families has been 2.3 for more than thirty years. This is unlikely to fall by much over the next generation.
Based on all of the above, in the next 25 years—so for women entering their 20s now—it is probable that, as projected by the ONS and fertility experts, the completed family size will continue to decline, whilst the average number of children per mother will remain at more than 2.1, meaning at least 25% of women will reach age 45 childless.
The risk of ‘unplanned childlessness’
In recent years, more than 50% of women reaching age 30 have been childless; if 25% remain childless at age 45, that means there is a 50% risk that a woman who is childless at 30 will remain childless at 45.[11]
Reflecting on that last statement of 50% risk, some commentators phrase this as ‘unplanned’ or ‘unintended’ childlessness. It is as if this is something terrible that has happened to the woman, something that was beyond her control. Sadly, there are some women who want to be pregnant and have difficulties in conceiving or carrying to term, but without wishing to minimise the trauma for these women, the numbers of women who suffer from some health-related childlessness are too small to make up this 50% of women who are childless at age 30.
Increasing use of abortion
Young women in their 20s who want to postpone motherhood can do so in a number of ways; a few might abstain from sex, some will use contraception—including the increasing use of emergency contraception—and others will turn to abortion.
In July 2025, the ONS released its latest set of data related to Conceptions in England and Wales.[12] [13] From these data we can find how many women aged up to 30yo became pregnant each year and from these conceptions, how many resulted in births (maternities) or in abortions.
| Women aged up to 30 | ||||
| Year | Conceptions | Maternities | Abortions | Conceptions ending in abortion |
| 2012 | 510,112 | 382,142 | 127,970 | 25% |
| 2017 | 448,822 | 324,157 | 124,665 | 28% |
| 2022 | 415,955 | 264,324 | 151,631 | 36% |
These data show a reducing number of young women becoming pregnant each year but amongst those who do, an increasing use of abortion.
In 2022, women aged up to 25—Generation Z—had a total of 190,970 conceptions, of which 90,753, 48%, were ended in abortion.
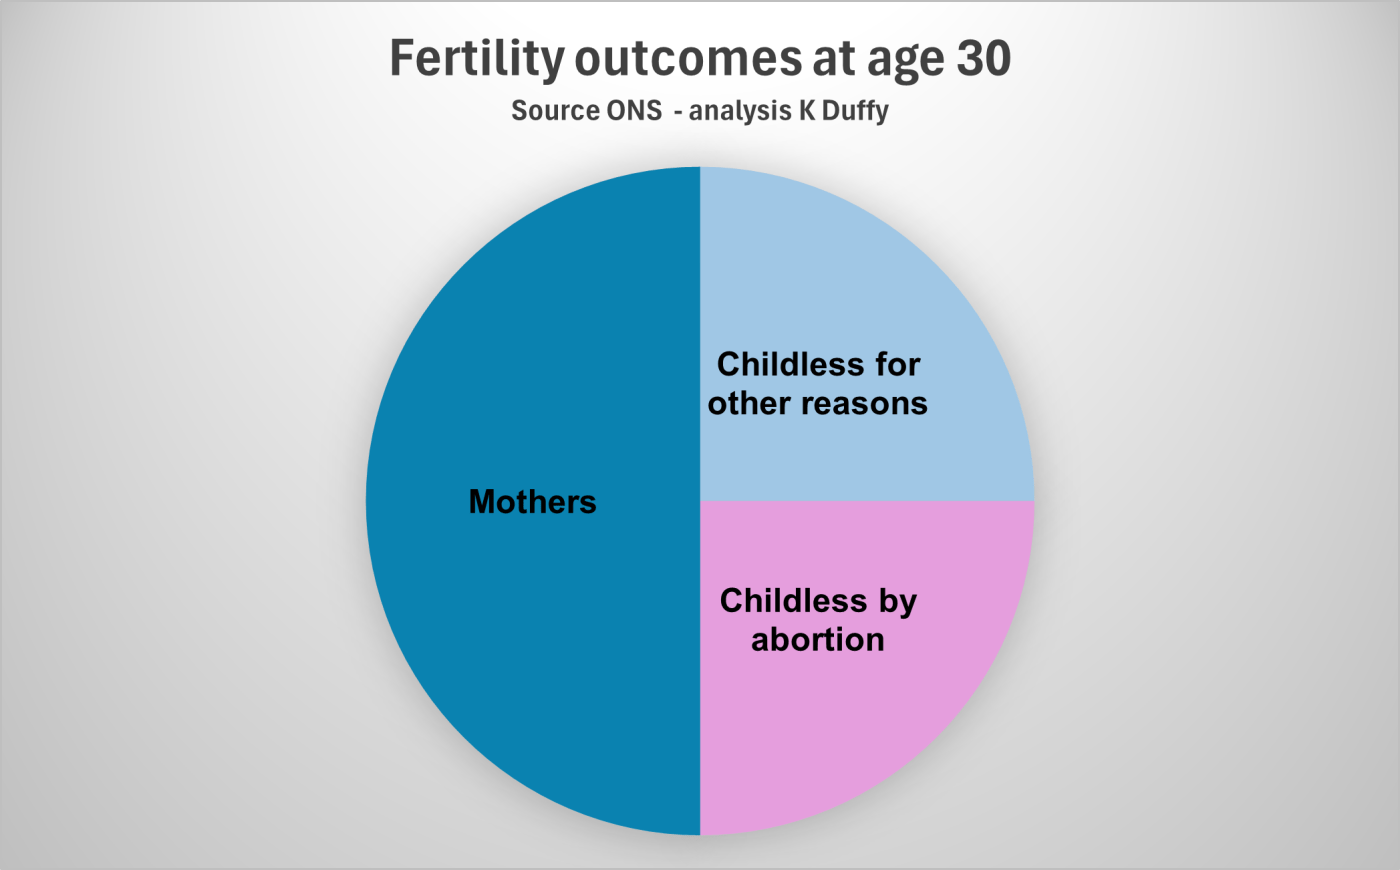
Half of childlessness at 30 is due to abortion

Our analysis of these ONS conceptions data over the ten years to 2022, shows that about half of young women who remain childless when reaching age 30 would not have been so without abortion in their teens and 20s. This is not unplanned childlessness; for these women it was a decision upon becoming pregnant not to continue into motherhood at that time, for a myriad of reasons.
Abortion at age 29 carries a 50% risk of childlessness
In 2022, the ONS shows just over 410,000 women aged 29, about 11,000 of whom chose to end a pregnancy by abortion. We know from the OHID Abortion Statistics report that about half of these 11,000 had a parity of 1+. In other words, they had had one or more previous pregnancies that resulted in a live or stillbirth.[14]
So, 5,500 childless women became pregnant when aged 29 and chose to end that pregnancy by abortion. Applying the risk factor for women childless at 30 remaining childless at 45, we can project that in 2022, 2,800 childless 29-year-olds who had an abortion will sadly remain childless by age 45, never having a child.
I am not suggesting that abortion causes infertility. But if an abortion leaves a woman childless at 30, she will then find herself where timing pressures and the natural decline of fertility come into play—resulting in a 50/50 chance she will still be childless at 45.
The majority of these 5,500 will want to have children; it is very unlikely that they were warned by the abortion providers that there is a 50% risk that this might not happen. A risk this high demands to be fully investigated and women need to be told.
Download as a PDF
[1] Although this analysis focuses on England and Wales, the same holds true for the United Kingdom as a whole.
[2] Population Health Monitoring Group. (2025, August 26). Births in England and Wales – Office for National Statistics. https://www.ons.gov.uk/peoplepopulationandcommunity/birthsdeathsandmarriages/livebirths/bulletins/birthsummarytablesenglandandwales/2024refreshedpopulations
[3] The ONS offers this definition of total fertility rate: “TFR is the average number of live children a group of women would have if they experienced the age-specific fertility rates for the calendar year in question throughout their childbearing lifespan.”
[4] National population projections, fertility assumptions: 2022-based – Office for National Statistics. (n.d.). https://www.ons.gov.uk/peoplepopulationandcommunity/populationandmigration/populationprojections/methodologies/nationalpopulationprojectionsfertilityassumptions2022based
[5] Ibid. The ONS states: “Women in the UK would need to have 2.075 children on average to ensure long-term natural replacement of the population.”
[6] Team, D. (2025, April 1). Childbearing for women born in different years, England and Wales – Office for National Statistics. https://www.ons.gov.uk/peoplepopulationandcommunity/birthsdeathsandmarriages/conceptionandfertilityrates/bulletins/childbearingforwomenbornindifferentyearsenglandandwales/2023
[7] Shaw, S. J. (2025). On a microdemographic framework for decomposing contemporary fertility dynamics. In Scientific Reports (p. 15:30726). https://www.nature.com/articles/s41598-025-11522-9.pdf PDF File
[8] Childbearing for women born in different years – Office for National Statistics. (2025, April 2). https://www.ons.gov.uk/peoplepopulationandcommunity/birthsdeathsandmarriages/conceptionandfertilityrates/datasets/childbearingforwomenbornindifferentyearsreferencetable
[9] National population projections, fertility assumptions: 2022-based – Office for National Statistics. (n.d.). Methodological approach and Expert views on future fertility. https://www.ons.gov.uk/peoplepopulationandcommunity/populationandmigration/populationprojections/methodologies/nationalpopulationprojectionsfertilityassumptions2022based#methodological-approach
[10] Formulas: (CFS = CPM x TMR), (TCR = 1 – TMR), and TCR = (1-(CFS/CPM)
[11] Formula: Risk = P(childless at 45) / P(childless at 30). Reason: every woman who is childless at 45 was necessarily childless at 30, so the fraction of those childless at 30 who remain childless by 45 equals the proportion childless at 45 divided by the proportion childless at 30.
[12] Population Health Monitoring Group. (2025, July 8). Conceptions in England and Wales – Office for National Statistics. https://www.ons.gov.uk/peoplepopulationandcommunity/birthsdeathsandmarriages/conceptionandfertilityrates/bulletins/conceptionstatistics/latest
[13] Conceptions in England and Wales – Office for National Statistics. (2025, July 9). https://www.ons.gov.uk/peoplepopulationandcommunity/birthsdeathsandmarriages/conceptionandfertilityrates/datasets/conceptionstatisticsenglandandwalesreferencetables
[14] Abortion statistics, England and Wales: 2022. (2025, April 9). GOV.UK. https://www.gov.uk/government/statistics/abortion-statistics-for-england-and-wales-2022/abortion-statistics-england-and-wales-2022
