We are missing a critical factor when we discuss the increasing decline in fertility and do not consider or address the impact of abortion. Data from the ONS show us quite clearly that the ‘gap’ between live births and the total needed for replacement has generally been less than the number of abortions. That said, we are still, by a significant majority (70%), a pro-life country.
Demographers, politicians, commentators, and many others are speaking about the global collapse in fertility and the urgent need to address this. Fertility is most often measured and reported using the Total Fertility Rate (TFR), which is the average number of children born to a woman, and her partner, during her lifetime. We need a TFR of about 2.1 in order to have a stable population total; any less than 2.1 will result, over time, in a decline in population numbers. For some, a lower global population seems like a good thing, after all can the Earth really support our growing numbers. Others, those who consider the likely societal and economic impacts, point to the decreasing ratio of young taxpayers and those who are older and relying on benefits and long-term care.
TFR in the UK has been below the replacement rate (2.1) since 1973, so why does it seem that this is only now becoming an urgent issue? One possible reason is that in 2023, for the first time (apart from the 2020 impact of Covid-19) the total number of deaths in the UK was greater than the total number of births.

The UK population has been growing since 1973, when we dipped below the replacement TFR, but as we discussed in this earlier post, this is largely due to immigration.
There are many issues being put forward as the key drivers of this increasing decline in the annual number of births. These are well covered by Daniel Hess writing recently for the Institute for Family Studies,[1] in which he summarises the big elements at play as:
“People need to be motivated to have families: they usually want to have a reliable and committed partner, economic stability, a suitable home, and a plan for child care. And all this must happen while they are still young and fertile.”
I have no intention of taking away from the thinking and analysis that lies behind these key drivers, but I do want to say that we cannot fully discuss the decline in TFR without considering the impact of abortion as one of the most critical enablers.
Across the UK, abortion numbers are increasing steeply; in this recent post we speculated that there may have been as many as 300,000 abortions in 2024, about 800 per day, every day.
One of the measures of abortion is the number each year per 1,000 women of reproductive age (15-44) (WRA). This has been slowly rising since 1973 when it was reported by the Office for National Statistics (ONS) to be 11.0, by the year 2000 it had risen to 15.4; seven years ago it was still around 16 but has increased sharply in recent years to 22 in 2023.
The ONS also reports the number of live births per 1,000 WRA, which enables us to consider the historical trend for the annual number of viable, healthy, pregnancies and how these have either resulted in a live birth or an induced abortion. When using this ‘viable’ metric we are not counting pregnancies that sadly end in a natural, spontaneous, miscarriage or stillbirth; though we do not count these, we are in no way minimising the tragedy of such loss and the trauma for women and their loved ones.
In order to maintain our natural population total, and achieve a TFR of 2.1, we need to have an annual total of about 70 viable pregnancies per 1,000 WRA per year.
This graph shows these data from 1969 to 2023. It can be seen quite clearly that the number of live births has been below the replacement rate since 1973 and has fallen sharply in recent years. We can also see that the ‘gap’ between live births and the total needed for replacement has generally been less than the number of abortions.
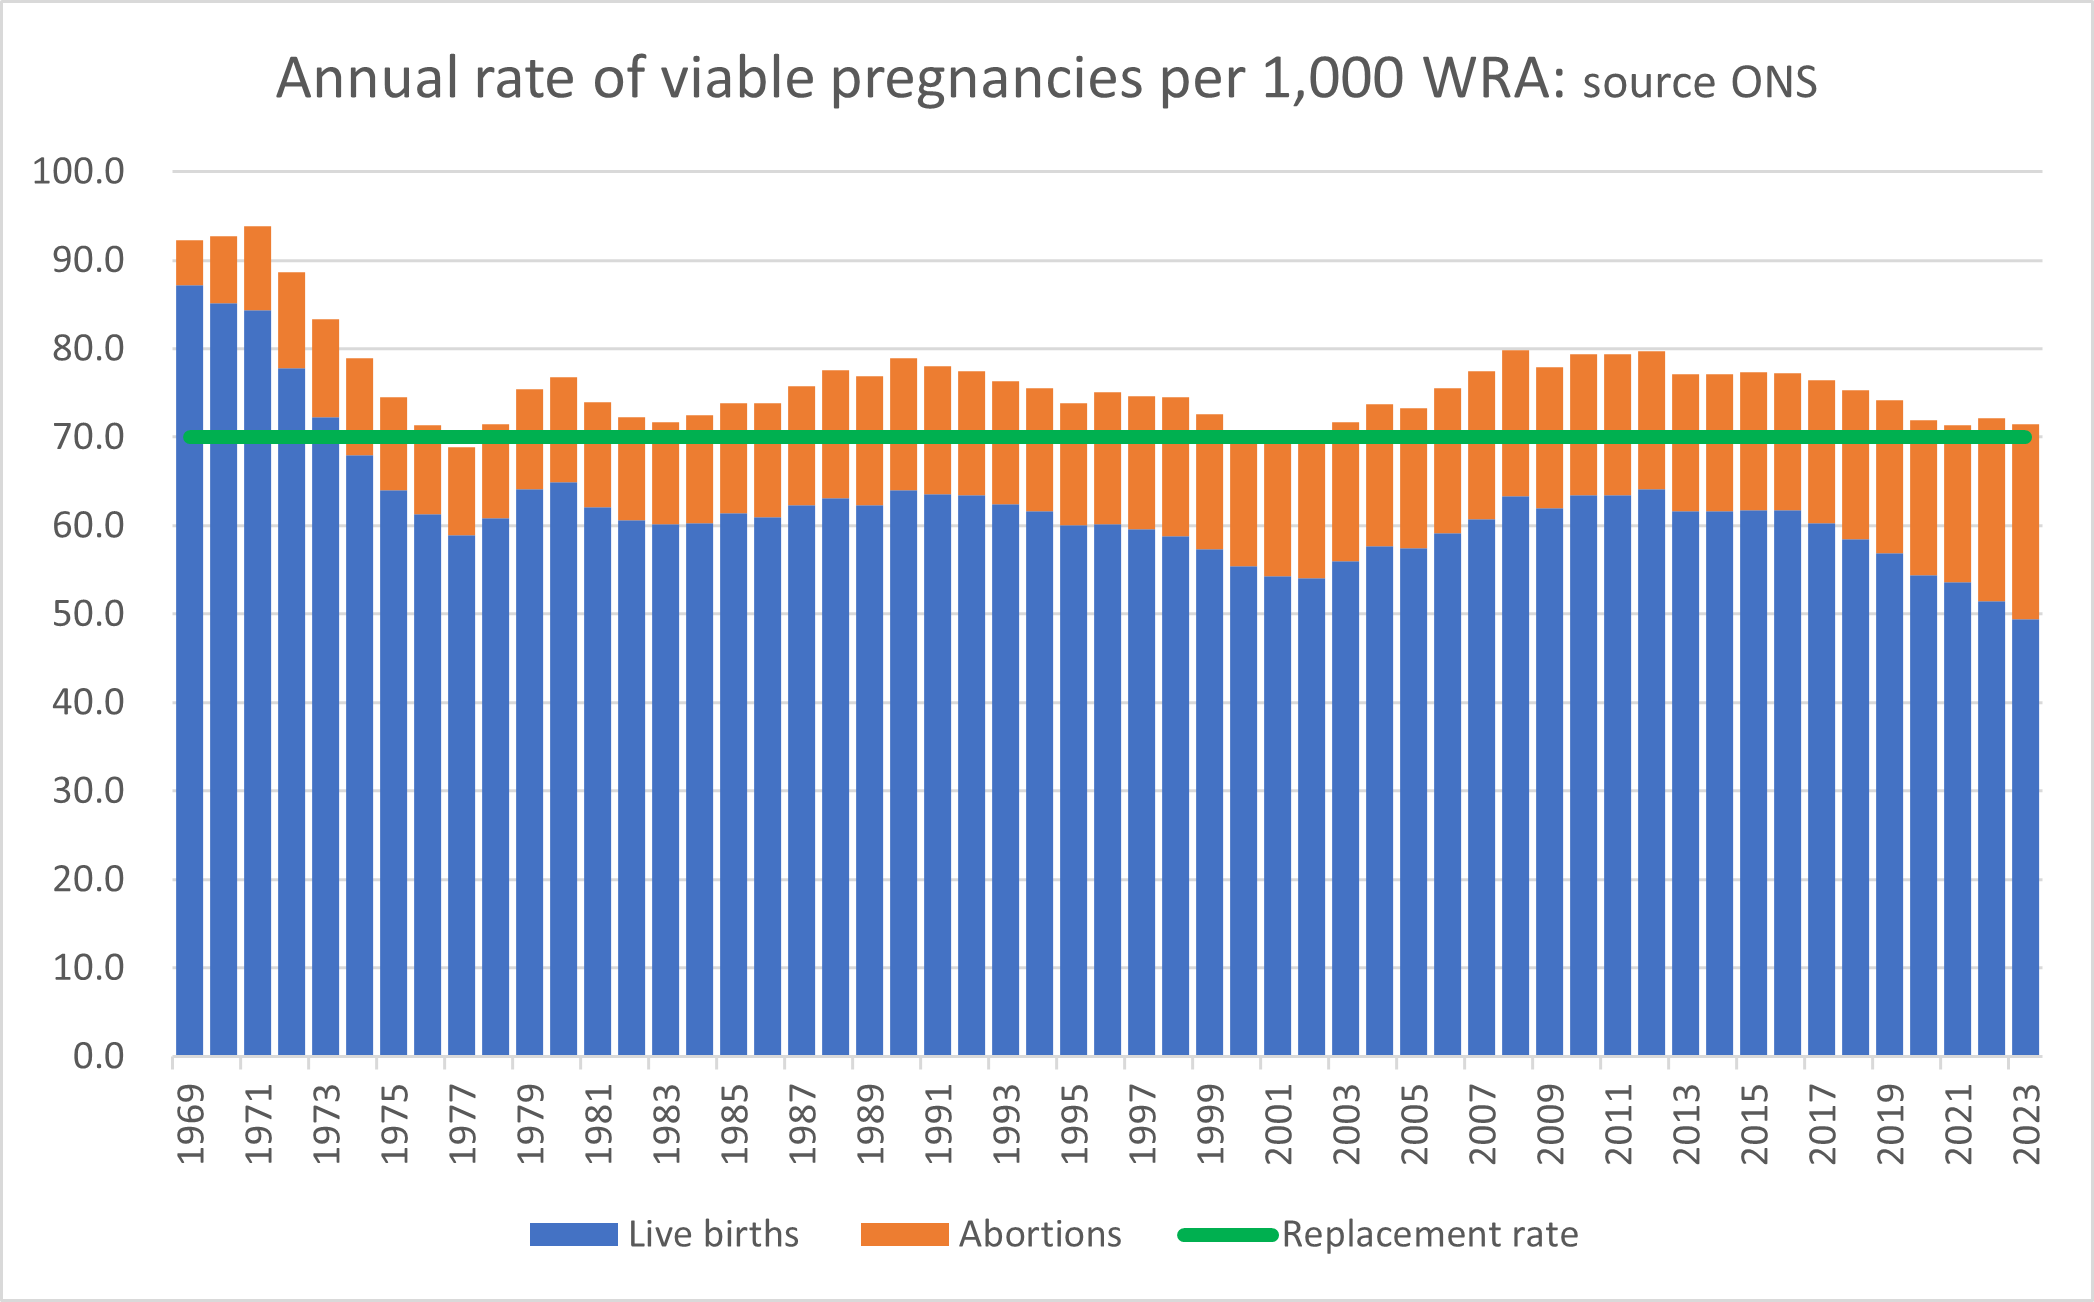
Ten years ago, abortions represented one-in-five (four-in-twenty) of all viable pregnancies, by 2020, this had risen to one-in-four (five-in-twenty), and in 2023, it is now three-in-ten (six-in-twenty); meaning that for every twenty viable pregnancies, there are fourteen live births and six induced abortions.
The abortion lobby and campaigners often claim that we are an “overwhelmingly pro-choice country”, as did Heidi Stewart, the BPAS CEO, when recently responding to JD Vance.[2]
But she and her supporters are wrong; notwithstanding the pace in the growth and impact of abortion, we are still largely a pro-life country; when reality comes home, more than twice as many pregnant women choose to continue with their pregnancies compared to those choosing abortion, 70% vs 30%. When polled, we might say that we support a woman’s right to choose abortion, but it’s different when it’s our own choice about the new life we are bringing into the world.
[1] How to think about Birthrates: A multi-factored approach. (n.d.). Institute for Family Studies. https://ifstudies.org/blog/how-to-think-about-birthrates-a-multi-factored-approach
[2] Topping, A. (2025, February 15). JD Vance decried as extremist over attack on UK abortion clinic safe zones. The Guardian. https://www.theguardian.com/world/2025/feb/15/jd-vance-decried-as-extremist-over-attack-on-uk-abortion-clinic-safe-zones
Discover more from Percuity
Subscribe to get the latest posts sent to your email.
